Writing inaccurate benchmarks

In general, we should never guess about performance. When writing optimizations, so many factors may come into play that even if we have a strong opinion about the results, it’s rarely a bad idea to test them. However, writing benchmarks isn’t straightforward. It can be pretty simple to write inaccurate benchmarks and make wrong assumptions based on them. The goal of this post is to examine four common and concrete traps leading to inaccuracy:
- Not resetting or pausing the timer
- Making wrong assumptions about micro-benchmarks
- Not being careful about compiler optimizations
- Being fooled by the observer effect
General concepts
Before discussing these traps, let’s briefly review how benchmarks work in Go. The skeleton of a benchmark is as follows:
The function name starts with the Benchmark prefix. The function under test (foo) is called within the for loop. b.N represents a variable number of iterations. When running a benchmark, Go tries to make it match the requested benchmark time. The benchmark time is set by default to 1 second and can be changed with the -benchtime flag. b.N starts at 1; if the benchmark completes in under 1 second, b.N is increased, and the benchmark runs again until b.N roughly matches benchtime:
Here, the benchmark took about 1 second, and foo was executed 73 times, for an average execution time of 16,511,228 nanoseconds. We can change the benchmark time using -benchtime:
foo was executed roughly twice more than during the previous benchmark.
Next, let’s look at some common traps.
Not resetting or pausing the timer
In some cases, we need to perform operations before the benchmark loop. These operations may take quite a while (for example, generating a large slice of data) and may significantly impact the benchmark results:
func BenchmarkFoo(b *testing.B) {
    expensiveSetup()
    for i := 0; i < b.N; i++ {
        functionUnderTest()
    }
}
In this case, we can use the ResetTimer method before entering the loop:
func BenchmarkFoo(b *testing.B) {
    expensiveSetup()
    b.ResetTimer() // Reset the benchmark timer
    for i := 0; i < b.N; i++ {
        functionUnderTest()
    }
}
Calling ResetTimer zeroes the elapsed benchmark time and memory allocation counters since the beginning of the test. This way, an expensive setup can be discarded from the test results.
What if we have to perform an expensive setup not just once but within each loop iteration?
func BenchmarkFoo(b *testing.B) {
    for i := 0; i < b.N; i++ {
        expensiveSetup()
        functionUnderTest()
    }
}
We can’t reset the timer, because that would be executed during each loop iteration. But we can stop and resume the benchmark timer, surrounding the call to expensiveSetup:
func BenchmarkFoo(b *testing.B) {
    for i := 0; i < b.N; i++ {
        b.StopTimer() // Pause the benchmark timer
        expensiveSetup()
        b.StartTimer() // Resume the benchmark timer
        functionUnderTest()
    }
}
Here, we pause the benchmark timer to perform the expensive setup and then resume the timer.
Note
There’s one catch to remember about this approach: if the function under test is too fast to execute compared to the setup function, the benchmark may take too long to complete. The reason is that it would take much longer than 1 second to reach benchtime. Calculating the benchmark time is based solely on the execution time of functionUnderTest. So, if we wait a significant time in each loop iteration, the benchmark will be much slower than 1 second. If we want to keep the benchmark, one possible mitigation is to decrease benchtime.
We must be sure to use the timer methods to preserve the accuracy of a benchmark.
Making wrong assumptions about micro-benchmarks
A micro-benchmark measures a tiny computation unit, and it can be extremely easy to make wrong assumptions about it. Let’s say, for example, that we aren’t sure whether to use atomic.StoreInt32 or atomic.StoreInt64 (assuming that the values we handle will always fit in 32 bits). We want to write a benchmark to compare both functions:
func BenchmarkAtomicStoreInt32(b *testing.B) {
    var v int32
    for i := 0; i < b.N; i++ {
        atomic.StoreInt32(&v, 1)
    }
}

func BenchmarkAtomicStoreInt64(b *testing.B) {
    var v int64
    for i := 0; i < b.N; i++ {
        atomic.StoreInt64(&v, 1)
    }
}
If we run this benchmark, here’s some example output:
cpu: Intel(R) Core(TM) i5-7360U CPU @ 2.30GHz
BenchmarkAtomicStoreInt32
BenchmarkAtomicStoreInt32-4    197107742           5.682 ns/op
BenchmarkAtomicStoreInt64
BenchmarkAtomicStoreInt64-4    213917528           5.134 ns/op
We could easily take this benchmark for granted and decide to use atomic.StoreInt64 because it appears to be faster. Now, for the sake of doing a fair benchmark, we reverse the order and test atomic.StoreInt64 first, followed by atomic.StoreInt32. Here is some example output:
BenchmarkAtomicStoreInt64
BenchmarkAtomicStoreInt64-4    224900722           5.434 ns/op
BenchmarkAtomicStoreInt32
BenchmarkAtomicStoreInt32-4    230253900           5.159 ns/op
This time, atomic.StoreInt32 has better results. What happened?
In the case of micro-benchmarks, many factors can impact the results, such as machine activity while running the benchmarks, power management, thermal scaling, and better cache alignment of a sequence of instructions. We must remember that many factors, even outside the scope of our Go project, can impact the results.
Note
We should make sure the machine executing the benchmark is idle. However, external processes may run in the background, which may affect benchmark results. For that reason, tools such as perflock can limit how much CPU a benchmark can consume. For example, we can run a benchmark with 70% of the total available CPU, giving 30% to the OS and other processes and reducing the impact of the machine activity factor on the results.
One option is to increase the benchmark time using the -benchtime option. Similar to the law of large numbers in probability theory, if we run a benchmark a large number of times, it should tend to approach its expected value (assuming we omit the benefits of instructions caching and similar mechanics).
Another option is to use external tools on top of the classic benchmark tooling. For instance, the benchstat tool, which is part of the golang.org/x repository, allows us to compute and compare statistics about benchmark executions.
Let’s run the benchmark 10 times using the -count option and pipe the output to a specific file:
$ go test -bench=. -count=10 | tee stats.txt
cpu: Intel(R) Core(TM) i5-7360U CPU @ 2.30GHz
BenchmarkAtomicStoreInt32-4     234935682                5.124 ns/op
BenchmarkAtomicStoreInt32-4     235307204                5.112 ns/op
// ...
BenchmarkAtomicStoreInt64-4     235548591                5.107 ns/op
BenchmarkAtomicStoreInt64-4     235210292                5.090 ns/op
// ...
We can then run benchstat on this file:
The results are the same: both functions take on average 5.10 nanoseconds to complete. We also see the percent variation between the executions of a given benchmark: ± 1%. This metric tells us that both benchmarks are stable, giving us more confidence in the computed average results. Therefore, instead of concluding that atomic.StoreInt32 is faster or slower, we can conclude that its execution time is similar to that of atomic.StoreInt64 for the usage we tested (in a specific Go version on a particular machine).
In general, we should be cautious about micro-benchmarks. Many factors can significantly impact the results and potentially lead to wrong assumptions. Increasing the benchmark time or repeating the benchmark executions and computing stats with tools such as benchstat can be an efficient way to limit external factors and get more accurate results, leading to better conclusions.
Let’s also highlight that we should be careful about using the results of a micro-benchmark executed on a given machine if another system ends up running the application. The production system may act quite differently from the one on which we ran the micro-benchmark.
Not being careful about compiler optimizations
Another common mistake related to writing benchmarks is being fooled by compiler optimizations, which can also lead to wrong benchmark assumptions. In this section, we look at Go issue 14813 (https://github.com/golang/go/issues/14813, also discussed by Go project member Dave Cheney) with a population count function (a function that counts the number of bits set to 1):
const m1 = 0x5555555555555555
const m2 = 0x3333333333333333
const m4 = 0x0f0f0f0f0f0f0f0f
const h01 = 0x0101010101010101

func popcnt(x uint64) uint64 {
    x -= (x >> 1) & m1
    x = (x & m2) + ((x >> 2) & m2)
    x = (x + (x >> 4)) & m4
    return (x * h01) >> 56
}
This function takes and returns a uint64. To benchmark this function, we can write the following:
However, if we execute this benchmark, we get a surprisingly low result:
A duration of 0.28 nanoseconds is roughly one clock cycle, so this number is unreasonably low. The problem is that the developer wasn’t careful enough about compiler optimizations. In this case, the function under test is simple enough to be a candidate for inlining: an optimization that replaces a function call with the body of the called function and lets us prevent a function call, which has a small footprint. Once the function is inlined, the compiler notices that the call has no side effects and replaces it with the following benchmark:
The benchmark is now empty — which is why we got a result close to one clock cycle. To prevent this from happening, a best practice is to follow this pattern:
- During each loop iteration, assign the result to a local variable (local in the context of the benchmark function).
- Assign the latest result to a global variable.
In our case, we write the following benchmark:
var global uint64 // Define a global variable
func BenchmarkPopcnt2(b *testing.B) {
var v uint64 // Define a local variable
for i := 0; i < b.N; i++ {
v = popcnt(uint64(i)) // Assign the result to the local variable
}
global = v // Assign the result to the global variable
}
global is a global variable, whereas v is a local variable whose scope is the benchmark function. During each loop iteration, we assign the result of popcnt to the local variable. Then we assign the latest result to the global variable.
Note
Why not assign the result of the popcnt call directly to global to simplify the test? Writing to a global variable is slower than writing to a local variable (these concepts are discussed in 100 Go Mistakes, mistake #95: “Not understanding stack vs. heap”). Therefore, we should write each result to a local variable to limit the footprint during each loop iteration.
If we run these two benchmarks, we now get a significant difference in the results:
cpu: Intel(R) Core(TM) i5-7360U CPU @ 2.30GHz
BenchmarkPopcnt1-4      1000000000               0.2858 ns/op
BenchmarkPopcnt2-4 606402058 1.993 ns/op
BenchmarkPopcnt2 is the accurate version of the benchmark. It guarantees that we avoid the inlining optimizations, which can artificially lower the execution time or even remove the call to the function under test. Relying on the results of BenchmarkPopcnt1 could have led to wrong assumptions.
Let’s remember the pattern to avoid compiler optimizations fooling benchmark results: assign the result of the function under test to a local variable, and then assign the latest result to a global variable. This best practice also prevents us from making incorrect assumptions.
Being fooled by the observer effect
In physics, the observer effect is the disturbance of an observed system by the act of observation. This effect can also be seen in benchmarks and can lead to wrong assumptions about results. Let’s look at a concrete example and then try to mitigate it.
We want to implement a function receiving a matrix of int64 elements. This matrix has a fixed number of 512 columns, and we want to compute the total sum of the first eight columns, as shown in figure 1.
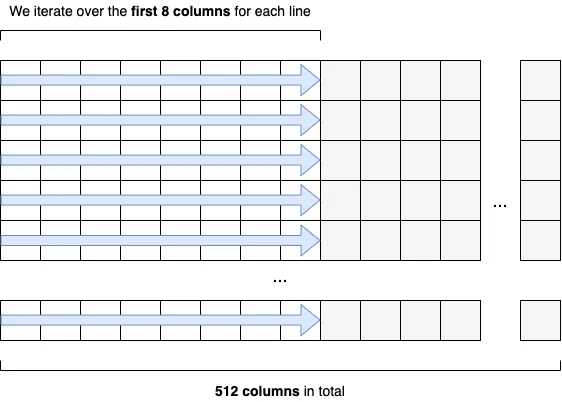
For the sake of optimizations, we also want to determine whether varying the number of columns has an impact, so we also implement a second function with 513 columns. The implementation is the following:
func calculateSum512(s [][512]int64) int64 {
    var sum int64
    for i := 0; i < len(s); i++ { // Iterate over each row
        for j := 0; j < 8; j++ { // Iterate over the first eight columns
            sum += s[i][j] // Increment sum
        }
    }
    return sum
}

func calculateSum513(s [][513]int64) int64 {
    // Same implementation as calculateSum512
}
We iterate over each row and then over the first eight columns, and we increment a sum variable that we return. The implementation in calculateSum513 remains the same.
We want to benchmark these functions to decide which one is the most performant given a fixed number of rows:
const rows = 1000

var res int64

func BenchmarkCalculateSum512(b *testing.B) {
    var sum int64
    s := createMatrix512(rows) // Create a matrix of 512 columns
    b.ResetTimer()
    for i := 0; i < b.N; i++ {
        sum = calculateSum512(s) // Create a matrix of 512 columns
    }
    res = sum
}

func BenchmarkCalculateSum513(b *testing.B) {
    var sum int64
    s := createMatrix513(rows) // Create a matrix of 513 columns
    b.ResetTimer()
    for i := 0; i < b.N; i++ {
        sum = calculateSum513(s) // Calculate the sum
    }
    res = sum
}
We want to create the matrix only once, to limit the footprint on the results. Therefore, we call createMatrix512 and createMatrix513 outside of the loop. We may expect the results to be similar as again we only want to iterate on the first eight columns, but this isn’t the case (on my machine):
cpu: Intel(R) Core(TM) i5-7360U CPU @ 2.30GHz
BenchmarkCalculateSum512-4        81854             15073 ns/op
BenchmarkCalculateSum513-4       161479              7358 ns/op
The second benchmark with 513 columns is about 50% faster. Again, because we iterate only over the first eight columns, this result is quite surprising.
To understand this difference, we need to understand the basics of CPU caches. In a nutshell, a CPU is composed of different caches (usually L1, L2, and L3). These caches reduce the average cost of accessing data from the main memory. In some conditions, the CPU can fetch data from the main memory and copy it to L1. In this case, the CPU tries to fetch into L1 the matrix’s subset that calculateSum is interested in (the first eight columns of each row). However, the matrix fits in memory in one case (513 columns) but not in the other case (512 columns).
Note
This isn’t in the scope of this post to explain why, but we look at this problem in 100 Go Mistakes, mistake #91: “Not understanding CPU caches.”
Coming back to the benchmark, the main issue is that we keep reusing the same matrix in both cases. Because the function is repeated thousands of times, we don’t measure the function’s execution when it receives a plain new matrix. Instead, we measure a function that gets a matrix that already has a subset of the cells present in the cache. Therefore, because calculateSum513 leads to fewer cache misses, it has a better execution time.
This is an example of the observer effect. Because we keep observing a repeatedly called CPU-bound function, CPU caching may come into play and significantly affect the results. In this example, to prevent this effect, we should create a matrix during each test instead of reusing one:
func BenchmarkCalculateSum512(b *testing.B) {
    var sum int64
    for i := 0; i < b.N; i++ {
        b.StopTimer()
        s := createMatrix512(rows) // Create a new matrix during each loop iteration
        b.StartTimer()
        sum = calculateSum512(s)
    }
    res = sum
}
A new matrix is now created during each loop iteration. If we run the benchmark again (and adjust benchtime — otherwise, it takes too long to execute), the results are closer to each other:
cpu: Intel(R) Core(TM) i5-7360U CPU @ 2.30GHz
BenchmarkCalculateSum512-4         1116             33547 ns/op
BenchmarkCalculateSum513-4          998             35507 ns/op
Instead of making the incorrect assumption that calculateSum513 is faster, we see that both benchmarks lead to similar results when receiving a new matrix.
As we have seen in this post, because we were reusing the same matrix, CPU caches significantly impacted the results. To prevent this, we had to create a new matrix during each loop iteration. In general, we should remember that observing a function under test may lead to significant differences in results, especially in the context of micro-benchmarks of CPU-bound functions where low-level optimizations matter. Forcing a benchmark to re-create data during each iteration can be a good way to prevent this effect.